https://s.campbellsci.com/documents/ca/manuals/tdr200_man.pdf
- Connect the coaxial cable to the coaxial port on the TDR200.
- Connect the micro USB to USB cable to the TDR 200 and the computer.

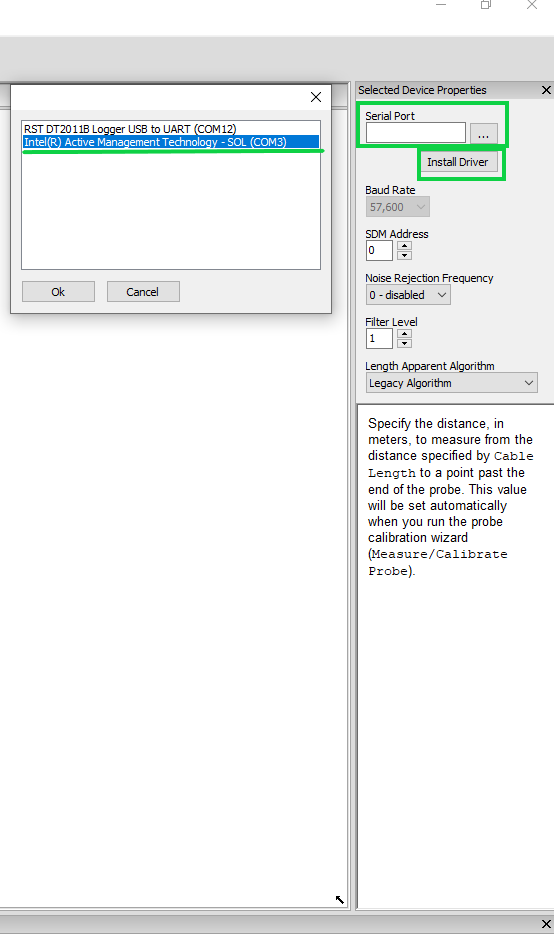
- Start the PC-TDR software and on the Network tab on the main page select the computer serial port you will be using to connect to the TDR200. On the ‘Selected Device Properties’ section. If required, the driver can be installed, but it is usually installed when the PC-TDR software is installed on the computer. The serial port is selected by clicking … and using the drop down to select the USB port that the TDR200 is connected to on the computer. None of the other settings have to be changed.
Click on and drag the "Coaxial" under the probe selection menu. If using a multiplexer, select the appropriate Multiplexer.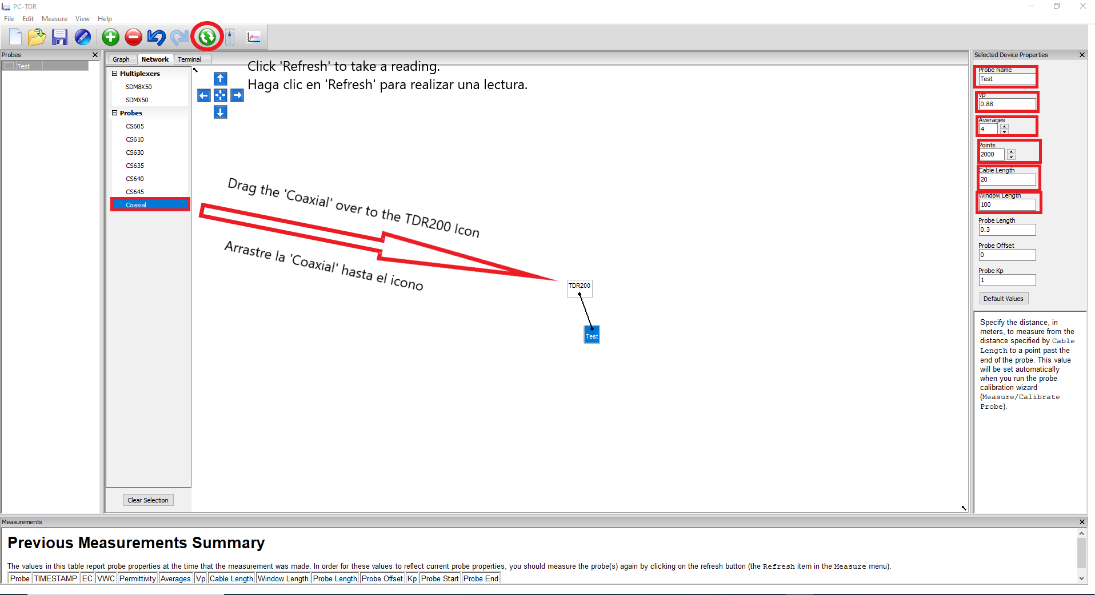
- Assign a name to each TDR cable.
- Set the Vp to 0.88 (Velocity of Propagation).
- Averages are set at 4
- The Points are set at 2000 to create 2000 measurement points over the length of the cable.
- The ‘Cable Length’ is the length of the cable above the ground surface.
- The ‘Window Length’ is the length of the cable that is installed in the borehole.

- Click on ‘Graph’ to see the graph of the 2000 measurements points over the length of the cable that is buried in the borehole. The values will range from 0 to 1 with the end of the cable moving to a value of 1.

- To take a measurement of the coaxial cable, press the refresh button on the toolbar or select Measure | Refresh from the menu. The measurements will be displayed in the Graph tab.
After taking a measurement, select Measure | Set Probe Baseline, if you would like to use the current measurement/waveform as a baseline. The baseline waveform will remain on the graph as additional measurements are taken and displayed. (Note that to see the baseline measurement, View | Show Baseline measurement must be selected. When selected it will have a checkmark next to it in the menu.)
In the screenshot below, the thin blue line shows the baseline measurement; the thicker blue line shows the current measurement.

- Exporting Data - Under File, choose ‘Import Probe Data’ and follow the instructions.
- Saving the data - Choose the directory to save the data.
For more information on using the software, choose PC-TDR Help under Help on the top menu.
