1. Subsurface Analysis
This document/video shows the steps to analyze any subsurface instrument like a Shape Array, an in-place inclinometer, etc.
2. Choose the site / project
3. On the top-right, select the filter option to see the devices via type, group.
4. Go the the device category, if selected "Type" in the filter options, and choose any sub surface device.
5. Click on the three dots or ellipsis to choose an option "Sub-Surface Chart" to go to subsurface analysis page.
6. Sub-Surface Analysis page will have pre-set charts and automatically will load last 7 days of the data.
7. User will be able to choose any time period as per the analysis objective. The resolution of the chart could be managed by choosing either, Daily, Weekly, Monthly or Yearly option on the top-right corner of the chart section.
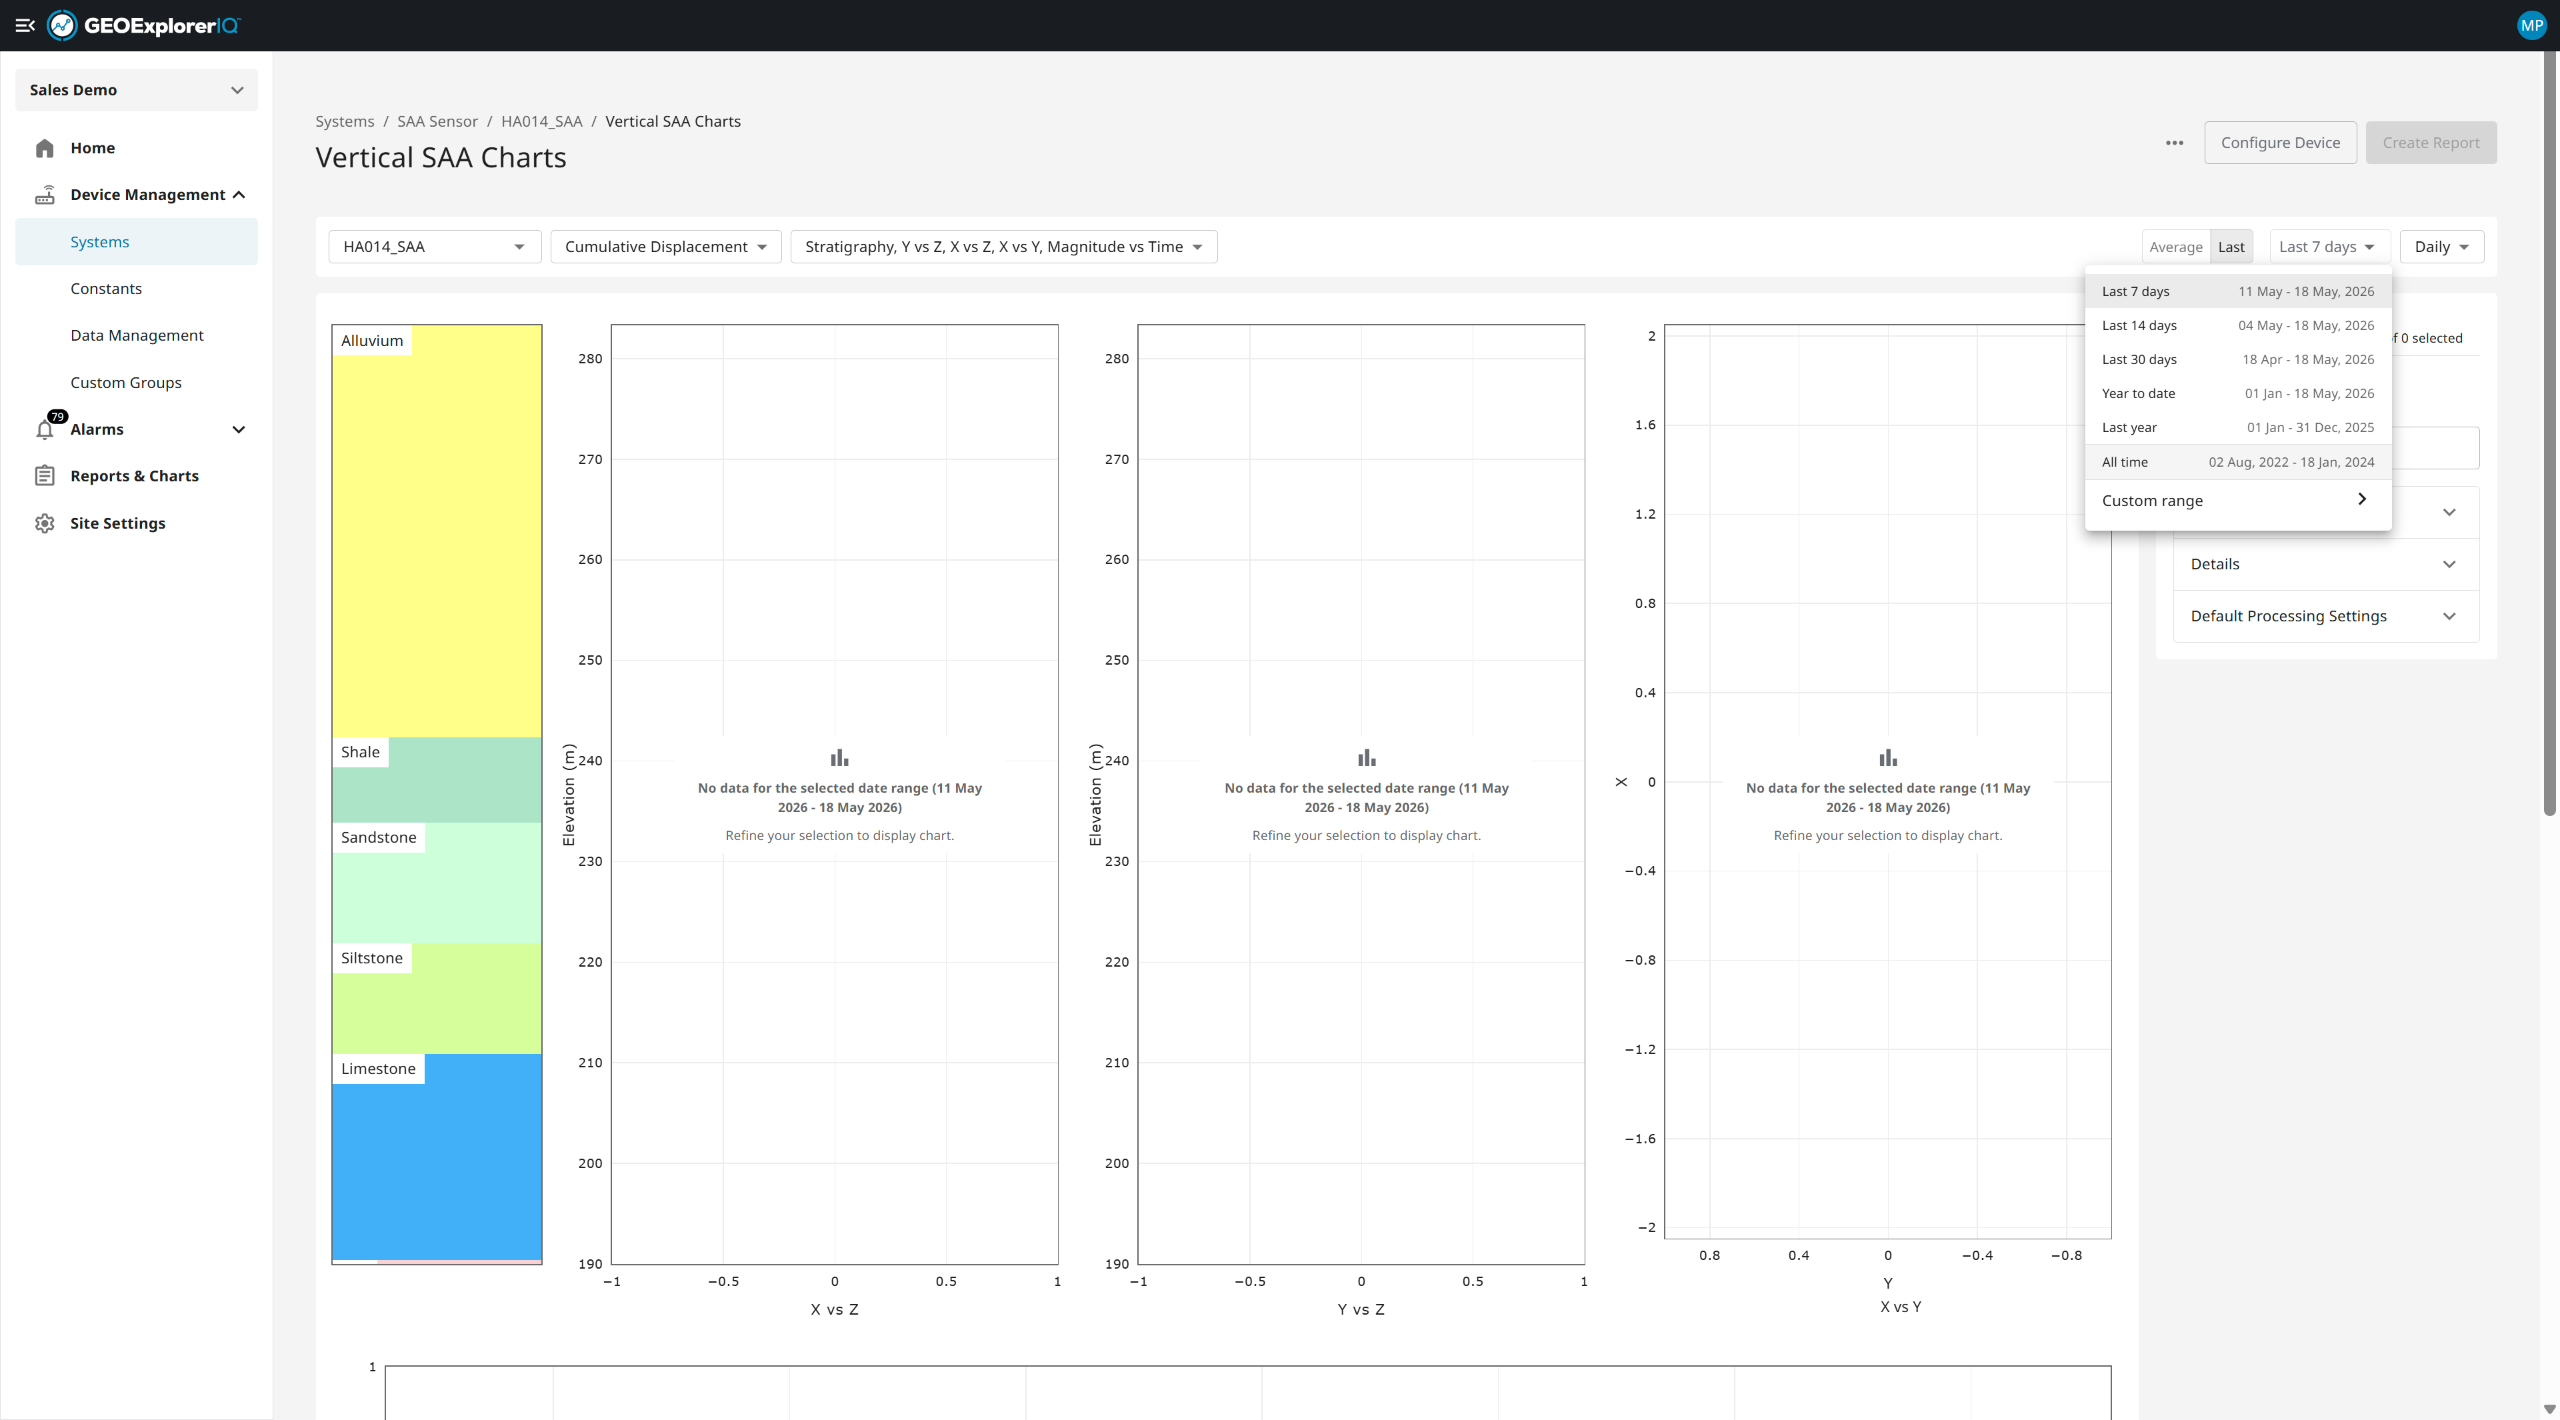
8. User will be able to select metric of interest for the analysis, either Cumulative Displacement, Cumulative Deviation or Incremental Displacement.
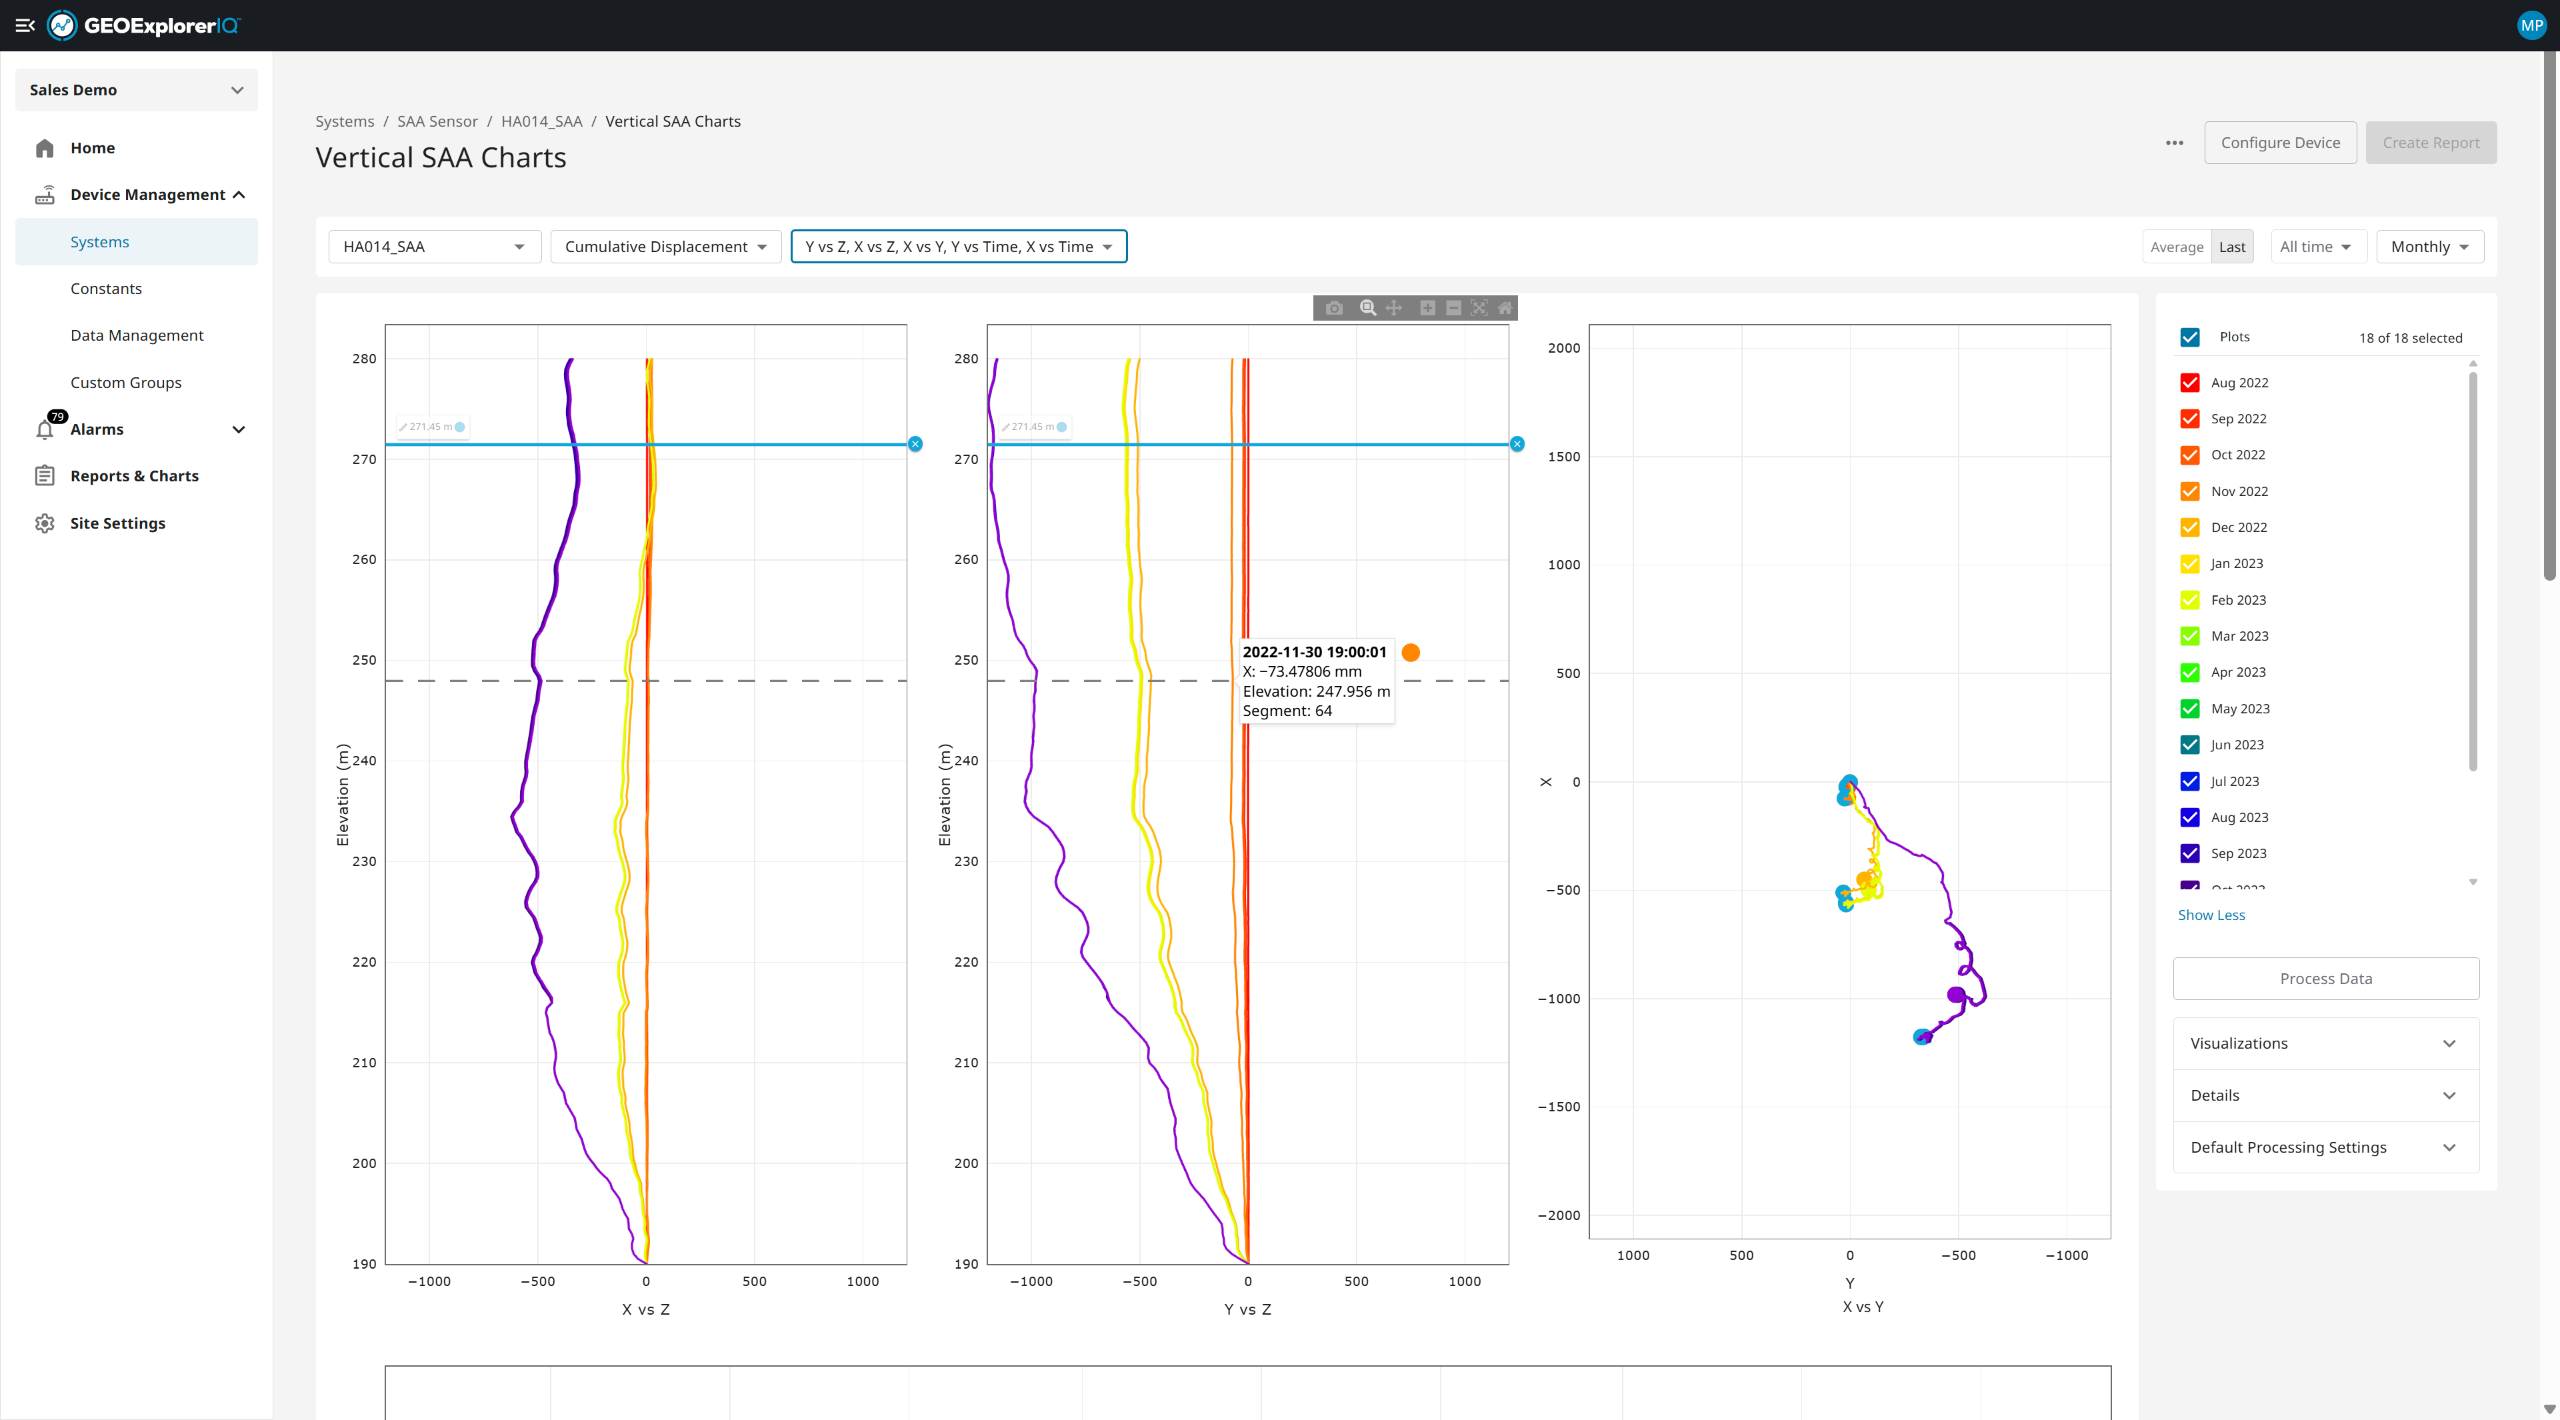
9. Right side panel will show the data binning with chosen resolution. User can de-select certain time-bin if needed.
10. The chart selection drop-down will give user different chart option to choose from based on the analysis they would want to conduct.
11. For further analyzing any segment of interest, Right-Click on "X vs Z" or "Y vs Z" chart. User can customize the color or shape of the legend of the chosen segment.
12. Up to 5 segments could be choen for comparison and analysis.
13. Once "x vs time" or "y vs Time" is selected from the chart drop-down menu, Scroll-down on the page to view the x vs time and y vs time charts,
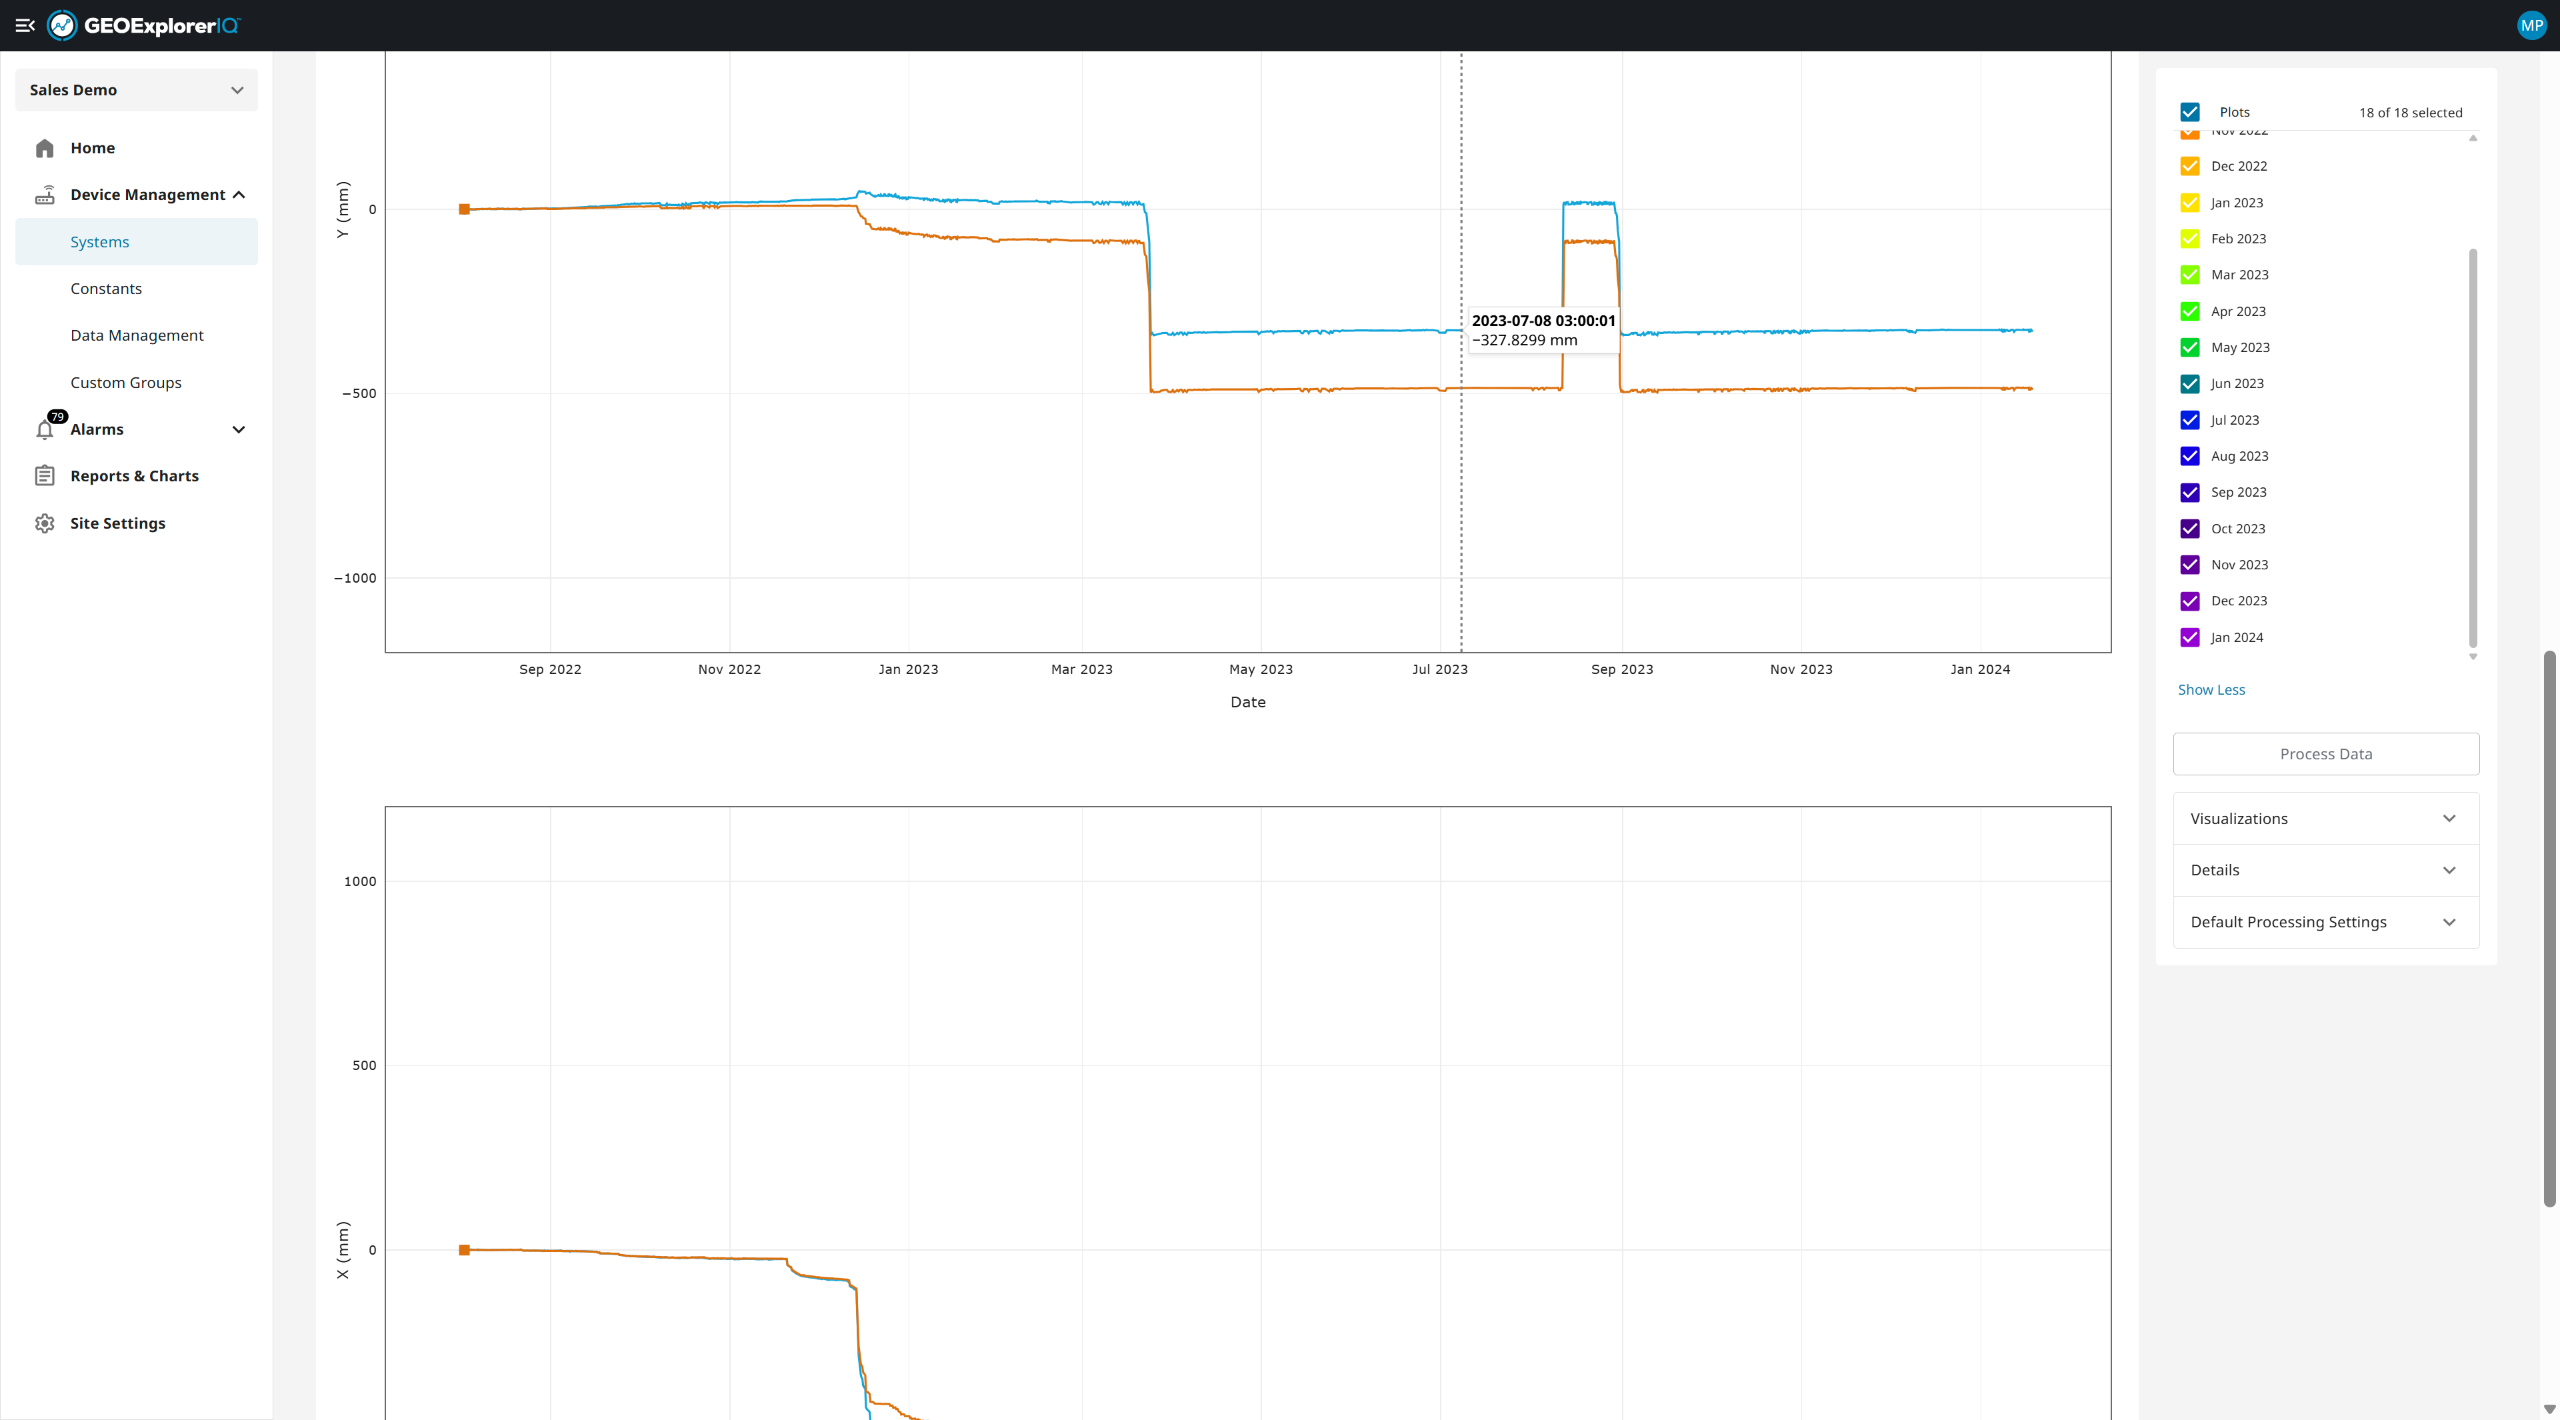
14. On the "X/Y vs Time" chart,, user can right-click to choose the time of interest. The selection will filter all the epoch / data trends from other time stamps in the depth/elevation chart.
15. User can process the shape array data use "Process Data" option
16. Investigate how displacement evolves across different soil horizons for comprehensive risk assessment.
17. Choose different processing parameters based on the installation and operational context.After selections, click on "Apply" on the bottom of the processing tab. This will update the visualization and data based on the parameters set.
18. Default processing setting will show the device configuration for analysis context.
19. The three dots or ellipsis on the top-right will provide options to download raw or calculated data.
20. Export calculated displacement data ready for immediate use in engineering reports and models.
21. Download the calculated data for specific time period.
22. Click on the "Configuration" option on the top-right for device configuraiton
23. User can configure the device for corrections, new baseline, adding configuration file in the device setting page.
24. User can also de-select any segment in the "Segments" option.